
Making more glamorous graphs in ggplot2
How to make glamorous graphics in ggplot2 inspired by William R. Chase.

R Markdown
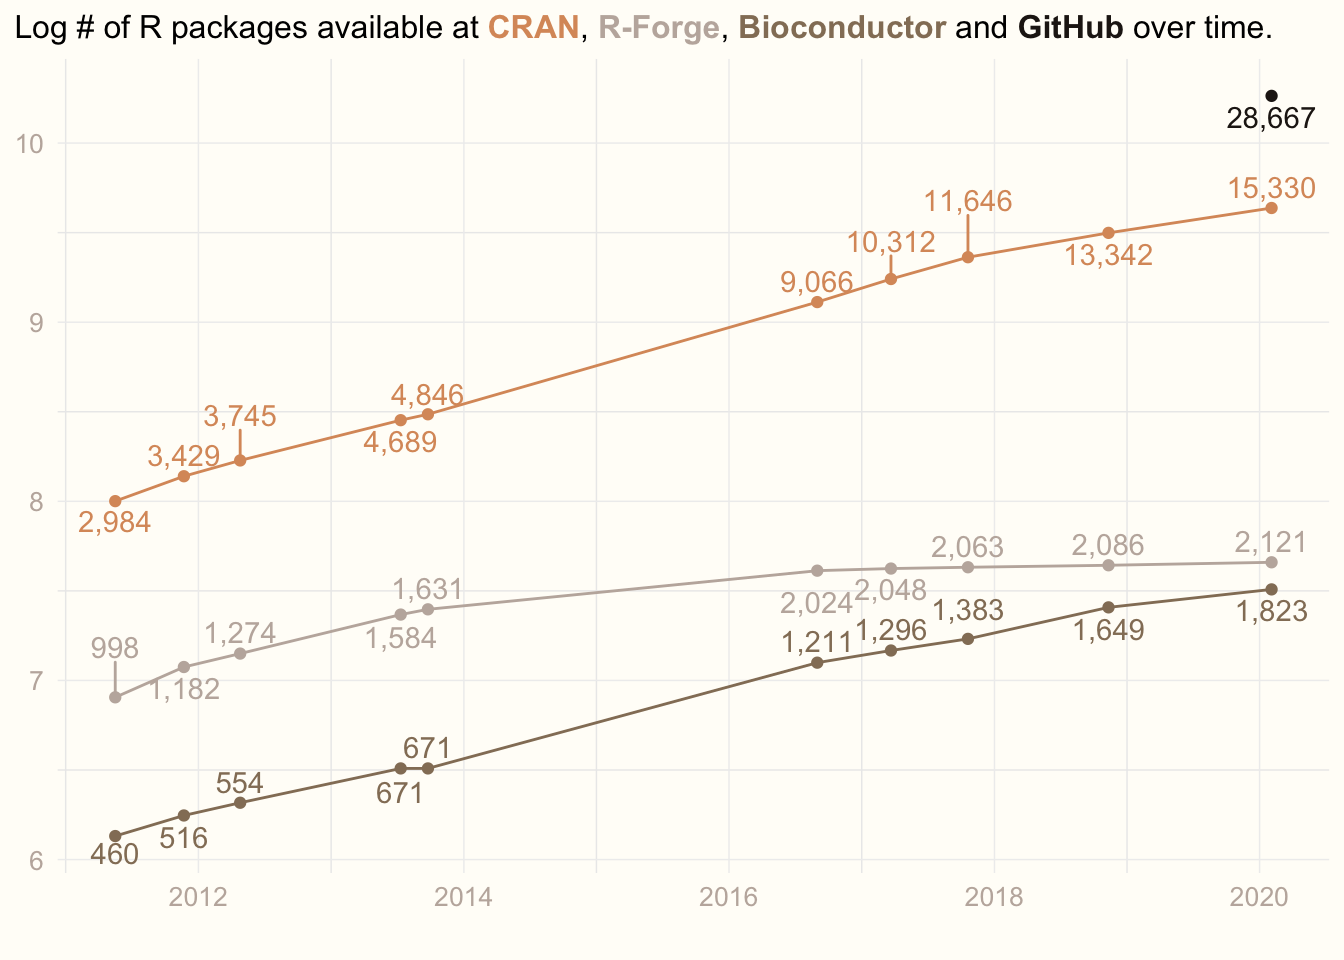
Inspired by William R. Chase’s rstudio::rconf2020 lecture “The Glamour of Graphics”, I have decided to enchance my old plot. The plot, I am showing every year to motivate my students to learn R. The plot shows how the number of R packages available in various repositories increases over years.
From William’s excellent lecture I have learnt to:
- Left-align titles.
- Use non-white backgrounds.
- Skip axis labels if not necessary.
- Use as few grid lines as possible.
- Try to capture the legend in the title.
and many other things, I will not implement here, e.g. to use professional fonts.
Libraries
I have used the following libraries in this project:
library(tidyverse)
library(curl)
library(stringr)
library(ggplot2)
library(ggrepel)
library(scales)
library(ggtext)
library(glue)
I have also started using excellent renv package, and my renv.lock file for this project is available here. Let’s be reproducible once and forever!
Data
I have an ugly and dirty function that scrapes CRAN, R-Forge, Bioconductor and, recently, also GitHub pages to retrieve the number of R packages (a bit problematic in the case of GitHub, but hopefully a good proxy). The function is ugly, I repeat the code that I should encapsulate in a function and parametrize. Well, no one is perfect.
interrogate_repos <- function() {
  # Interrogate CRAN
  cran_con <- curl::curl(url = 'https://cran.r-project.org/web/packages/index.html')
  cran <- paste0(readLines(con = cran_con, n = 20), collapse = '')
  cran_pkgs <- stringr::str_match(cran, 'repository features ([0-9]{1,}) available packages')[2]

  # Interrogate R-Forge
  rforge_con <- curl::curl(url = 'https://r-forge.r-project.org')
  rforge <- paste0(readLines(con = rforge_con, n = 200), collapse = '')
  rforge_pkgs <- stringr::str_replace(stringr::str_match(rforge, 'Projects: <strong>([0-9]{1,},[0-9]{1,})</strong>')[2],
                         ',',
                         '')

  # Interrogate Bioconductor
  bioconductor_con <- curl::curl(url = 'https://bioconductor.org')
  bioconductor <- paste0(readLines(con = bioconductor_con, n = 200), collapse = '')
  bioconductor_pkgs <- stringr::str_match(bioconductor, 'Software\">([0-9]{1,}).*software packages.')[2]

  # Interrogate GitHub
  github_con <- curl::curl(url = 'https://github.com/search?l=R&q=R+package&type=Repositories')
  github <- paste0(readLines(con = github_con, n = 1200, ), collapse = '')
  github_pkgs <- stringr::str_replace(stringr::str_match(github, '([0-9]{1,},[0-9]{1,}) repository results')[2],
                         ',',
                         '')

  day <- format(Sys.time(), "%Y-%m-%d")
  result <- c(day, cran_pkgs, rforge_pkgs, bioconductor_pkgs, github_pkgs)
  names(result) <- c('date', 'CRAN', 'R-Forge', 'Bioconductor', 'GitHub')
return(result)
}
Now, from time to time, I run the following code to update my dataset:
prev_data <- read_csv('num_pkgs_data.csv')
today <- interrogate_repos()
if (last(prev_data$date) < today[1]) {
  prev_data <- rbind(prev_data, today)
  write_csv(x = prev_data, 'num_pkgs_data.csv')
}
Yes, I know, I should use here, but I have a small fire extinguisher always at hand…
Now, my dataset looks like this:
prev_data## # A tibble: 10 x 5
## date cran rforge bioconductor github
## <date> <dbl> <dbl> <dbl> <dbl>
## 1 2011-05-17 2984 998 460 NA
## 2 2011-11-22 3429 1182 516 NA
## 3 2012-04-25 3745 1274 554 NA
## 4 2013-07-11 4689 1584 671 NA
## 5 2013-09-24 4846 1631 671 NA
## 6 2016-08-31 9066 2024 1211 NA
## 7 2017-03-22 10312 2048 1296 NA
## 8 2017-10-20 11646 2063 1383 NA
## 9 2018-11-11 13342 2086 1649 NA
## 10 2020-02-03 15330 2121 1823 28667Data transformation
In order to do something sensible, I will transform data from wide to long format:
data <- prev_data %>% pivot_longer(cols = c(cran, rforge, bioconductor, github), names_to = 'repo') %>%
  mutate(value = as.integer(value))
Plotting
Ready for plotting! I need some cool colors. On my way home from the rstudio::rconf2020, I watched Taika Waititi’s “Jojo Rabbit” movie which I found visually appealing. So, I grabbed a random screenshot from the movie and using the Colormind.io tool, I created two palettes based on the screenshot.
jojo1 <- c('#c0b3aa', '#2b2117', '#9a8268', '#d3a677', '#e1d0ba')
jojo2 <- c('#221c17', '#947e66', '#da9869', '#e0c6a4', '#c1b3ab')
Finally ready for plotting in the most glamorous way:)
cols <- c('bioconductor' = jojo2[2], 'cran' = jojo2[3], 'github' = jojo2[1], 'rforge' = jojo2[5])
colors = c('black', cols[2], 'black', cols[4], 'black', cols[1], 'black', cols[3], 'black')

title = glue('Log # of R packages available at',
             ' <span style="color:{cols[2]}">**CRAN**</span>,',
             ' <span style="color:{cols[4]}">**R-Forge**</span>,',
             ' <span style="color:{cols[1]}">**Bioconductor**</span>',
             ' and',
             ' <span style="color:{cols[3]}">**GitHub**</span>',
             ' over time.')

ggplot(data, mapping = aes(x = date, y = log(value), col = repo)) +
  geom_point(show.legend = F) +
  geom_line(show.legend = F) +
  geom_text_repel(aes(label = comma(value)), direction = 'y', vjust = 0.5, show.legend = F) +
  scale_colour_manual(values = cols) +
  labs(title = title, x = '', y = '') +
  theme_minimal() +
  theme(panel.grid.major = element_line(colour = '#EEEEEE', size = 0.25),
        plot.background = element_rect(fill = '#FFFDF8', colour = '#FFFDF8'),
        axis.title = element_text(colour = jojo2[5]),
        axis.text = element_text(colour = jojo2[5], size = 10),
        axis.title.y = element_blank(),
        plot.title = element_markdown(lineheight = 1.5, size = 12),
        plot.title.position = 'plot')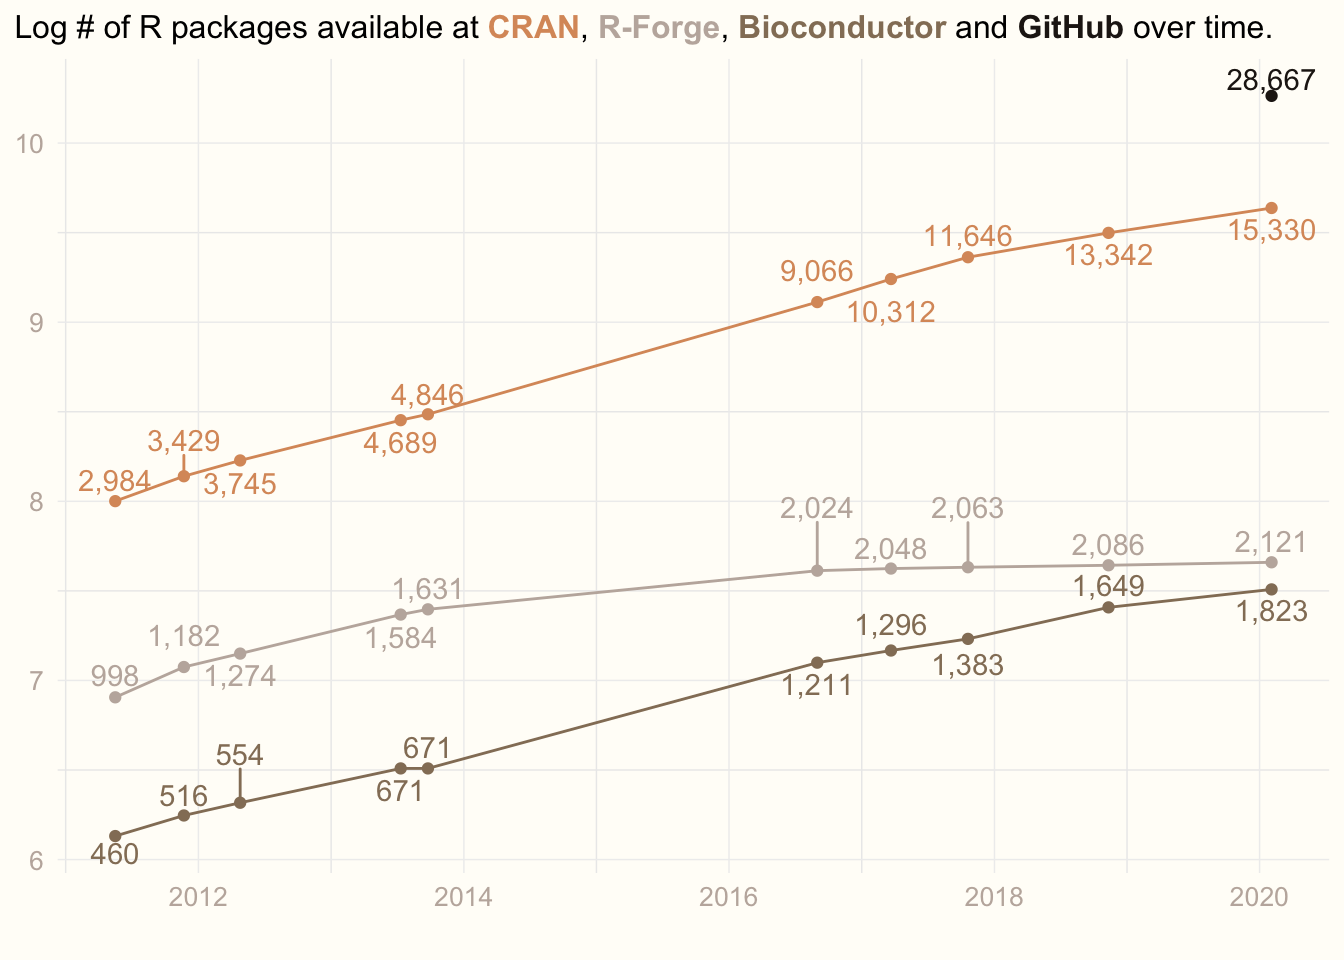
Twitter
Google+
Facebook
Reddit
LinkedIn
StumbleUpon
Pinterest
Email