Making more glamorous graphs in ggplot2
How to make glamorous graphics in ggplot2 inspired by William R. Chase.
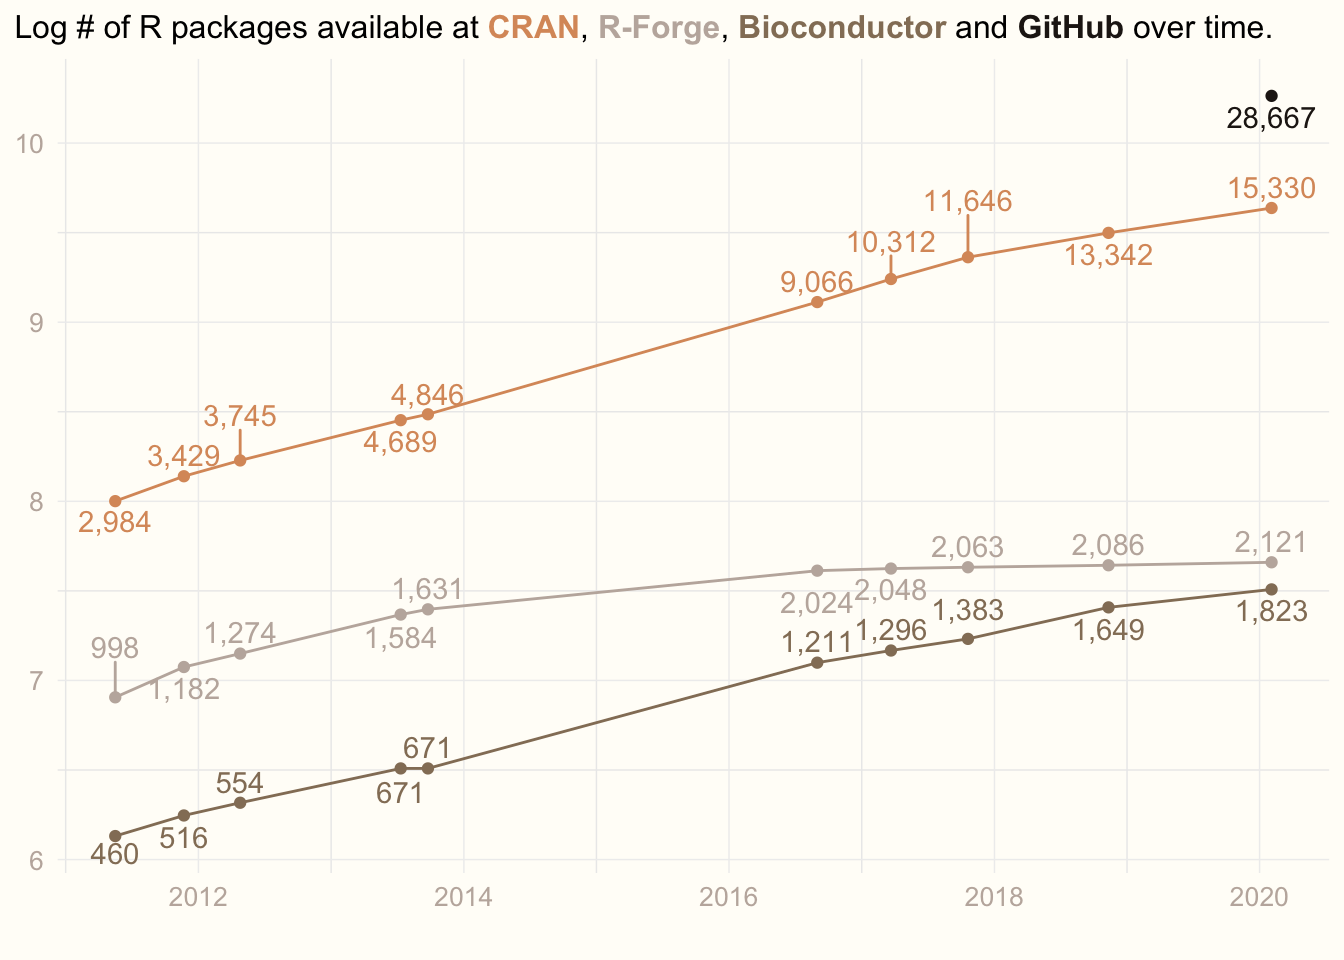
Inspired by William R. Chase’s rstudio::rconf2020 lecture “The Glamour of Graphics”, I have decided to enchance my old plot. The plot, I am showing every year to motivate my students to learn R. The plot shows how the number of R packages available in various repositories increases over years.